Decision Boundaries
Minimal risk decision function is unique and must be represented in terms of Distributions of data generating RVs X and Y
A is some subvolume of P. (n dimensional hypercubes or volume bodies)
P X , Y
Function that assigns every choice of A ⊆ P , c ∈ C
Decision function h : P → c 1 , … , c k R 1 , … , R k R i = { x ∈ P ∣ h ( x ) = c i }
If a test pattern falls into R i
Finding Decision Regions
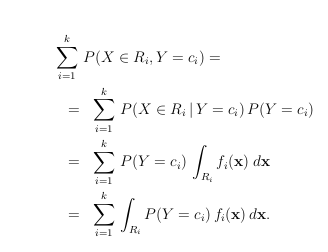
which yields the lowerst misclassification rate or highest Probability of correct classification
f i PDF for Class Conditional distribution Probability of obtaining a correct classification for R i Σ i = 1 k P ( X ∈ R i , Y = c i ) This region has curved boundaries aka decision boundaries
Folded and on higher dims : very complex and fragmented
x is a vector
For patterns on these boundaries, two or more classifications are equally probable
Maximal if R i = { x ∈ P ∣ i = a r g ma x j P ( Y = c j ) f j ( x )}
Then h o pt : P → C j x → c a r g ma x j P ( Y = c j ) f j ( x )
Algo learns estimates of the Class Conditional distribution and class probabilities aka priors
The separator between classes learned by a model in a binary class or multi-class classification problems. For example, in the following image representing a binary classification problem, the decision boundary is the frontier between the orange class and the blue class